E9B06
ANTENNAS AND TRANSMISSION LINES · Antenna patterns and designs: azimuth and elevation patterns; gain as a function of pattern; antenna modeling
E9B06E9B →
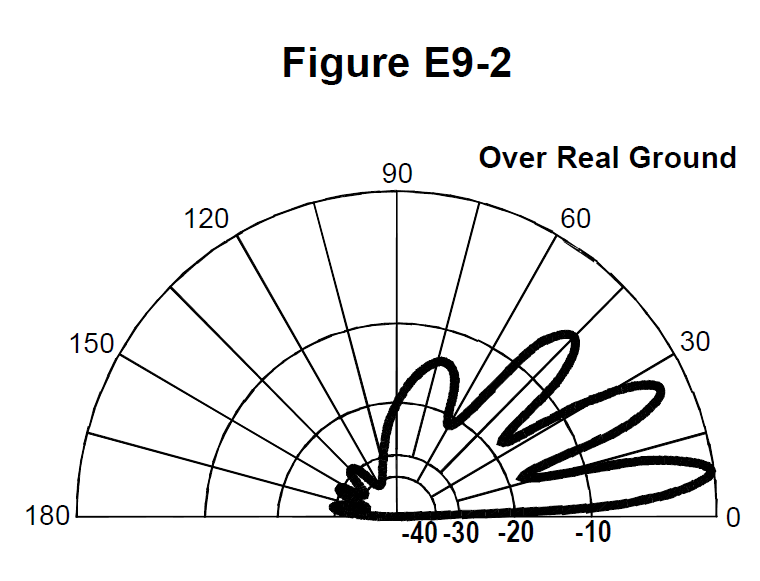
What is the elevation angle of peak response in the antenna radiation pattern shown in Figure E9-2?
- A45 degrees
- B75 degrees
- C7.5 degrees
- D25 degrees
Why Figure E9-2 is an elevation plot: the horizontal line at the left/right edge is the horizon (0 degrees) and angles are measured upward from it toward zenith (90 degrees), with radial grid lines every 15 degrees. The main lobe's maximum lies midway between the horizon and the first 15 degree radial, so the peak response occurs at 7.5 degrees. That low takeoff angle is typical of a horizontal antenna a wavelength or so above real ground, and it is exactly what you want for long-haul DX.
Watch out The choice that says 75 degrees is the same digits transposed and would describe a near-vertical cloud-warmer lobe; 45 degrees is just a grid line well above the main lobe, not its peak.
Elevation angles are measured up from the horizon; the grid is 15 degrees per line, and this lobe peaks at half of the first line.
HamSandwich explanation, first draft. The question and answers are the NCVEC text.
The rest of E9B
- E9B01 What is the 3 dB beamwidth of the antenna radiation pattern shown in Figure E9-1?
- E9B02 What is the front-to-back ratio of the antenna radiation pattern shown in Figure E9-1?
- E9B03 What is the front-to-side ratio of the antenna radiation pattern shown in Figure E9-1?
- E9B04 What is the front-to-back ratio of the radiation pattern shown in Figure E92?
- E9B05 What type of antenna pattern is shown in Figure E9-2?
- E9B06 What is the elevation angle of peak response in the antenna radiation pattern shown in Figure E9-2?
- E9B07 What is the difference in radiated power between a lossless antenna with gain and an isotropic radiator drive…
- E9B08 What is the far field of an antenna?
- E9B09 What type of analysis is commonly used for modeling antennas?
- E9B10 What is the principle of a Method of Moments analysis?
- E9B11 What is a disadvantage of decreasing the number of wire segments in an antenna model below 10 segments per ha…